
Detect regions of high mobility in a protein simulation.
You want to see if a region of a protein is presenting high fluctuations and conformation changes.
Sometimes is useful to detect regions of a system that have elevated motions and fluctuations. The fastest way to see this is visual inspection of the trajectory using a molecular visualizer, although sometimes the high fluctuations regions could not be obvious. One way of detecting regions of different conformations throughout a simulation is using 2 dimensional root mean square analysis. This analysis calculates the best-fit RMSD of each frame to each other frame and creates a plot that can aid in the identification of big conformation shifts throughout the trajectory.
For this recipe, we are going to use the 575 amino acid tyrosine phosphatase from the PDB code 1LAR that has a docked inhibitor in the active site.
The topology file is 1lar-nowater.parm7 and the trajectory data is 1lar-nowater-run1.nc ( ~3 microseconds of sampling time, 1.7 GB). The water has been deleted from the topology file (using parmstrip) and from the trajectories (using strip). The trajectory have also been autoimaged and rms fitted to the protein (see this recipe). Also, to save space, the trajectory was reduced to every 10th frame. The total number of frames is:
cpptraj -p 1lar-nowater.parm7 -y 1lar-nowater-run1.nc -tl
Frames: 15477
To calculate the sampling time, we multiply the number of frames times how frequent we saved the trajectory data (ntwx=5 000) times the time step used (0.004). This gives for 1lar-nowater-run1.nc = 15 477 x 5 000 x 0.004 = 309 540 ps, but remember that we only saved every 10th frame to save space, so 309 540 x 10 = 3 095 400 ps, which corresponds to 3.09 microseconds.
We are going to use the command rmsd2d over residues 1 to 575 to see if there are any noticeable changes in conformation during the simulation. The CPPTRAJ input script is:
parm 1lar-nowater.parm7
trajin 1lar-nowater-run1.nc 1 last 10
2drms :1-575@C,N,O,CA,CB&!@H= rmsout 2drms-all-residues.gnu
go
The script reads the topology using the parm command and reads the trajectory file using trajin. Notice that we are only going to read every 10th frame. This is to speed the 2drms command, otherwise it will take a long time to calculate all the pair-wise interactions. The command 2drms will use residues 1 to 575 using only the atoms named C, N, O, CA and CB and not considering hydrogen atoms. This means that only the backbone of the protein is going to be used for calculations. The information will be saved in a gnuplot type file with name 2drms-all-residues.gnu. If we plot this results with gnuplot we obtain:
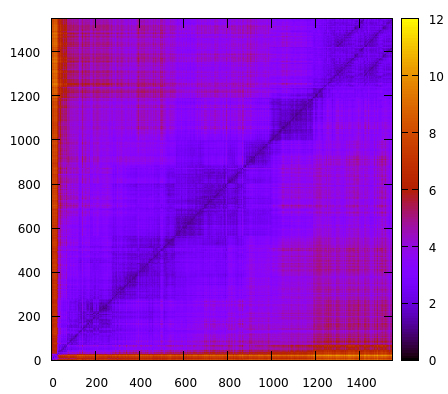
The x and y axis are the number of frames. Remember that our trajectory has ~15000 frames, but for this analysis we only read every 10th frame. The z axis is the RMSD value in angstroms. Although we can detect some regions where the rmsd values fluctuate, overall the simulation remains close to ~2-4 values, suggesting that no major conformational changes are occurring. One way to enhance our analysis, is perform a root mean square fluctuation analysis, which will help us detect if there is a sub-region of the system that we could possibly zoom in our 2drms analysis and detect any possible structural shifts. We use the atomicfluct command with this input script:
parm 1lar-nowater.parm7
trajin 1lar-nowater-run1.nc 1 last 10
atomicfluct out atomic-fluctuations.dat :1-575 byres
go
We read our topology and trajectory file as usual, then we call the atomicfluct command. The output file will be named atomic-fluctuations.dat, we will measure the fluctuations on residues 1 to 575 and the byres keyword focuses on a per-residue analysis, instead of per-atom analysis. The resulting data can be plotted with gnuplot:
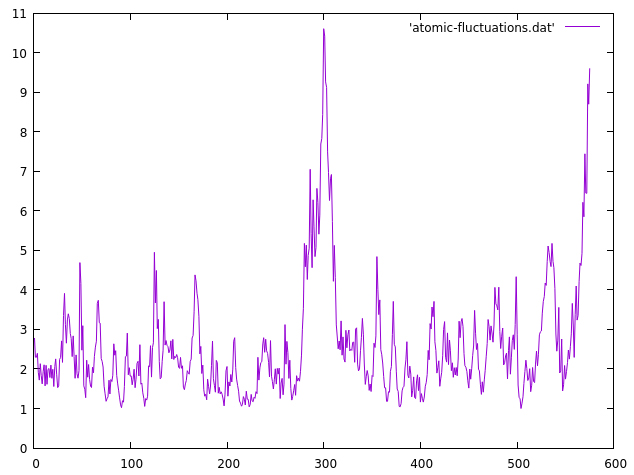
The x axis represents each residue (from 1 to 575) and the y axis is the residue fluctuation in angstroms. We can see now that most of the residues are within the ~2-4 range, as suggested by the previous 2drms plot, but we notice a central region of the protein that presents higher atomic fluctuations than the rest of the system. The area is within residues 280 to 310. We can do another 2drms plot focusing only on that region with the CPPTRAJ input:
parm 1lar-nowater.parm7
trajin 1lar-nowater-run1.nc 1 last 10
2drms :280-310@C,N,O,CA,CB&!@H= rmsout 2drms-280_310-residues.gnu
go
which now will only focus on residues 280 to 310. The result is:
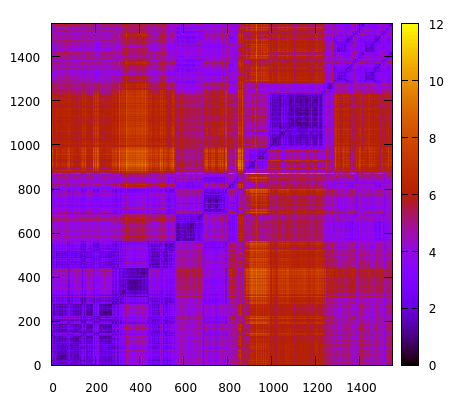
Using the atomicfluct command helped to identify a particular region of the system that could be exploring interesting molecular conformations. This new 2drms plot suggest that the protein region between residues 280 and 310 is experiencing conformation changes between values of ~2-10 angstroms that could influence the stability of the system. Further analysis could now be done on that particular region, for example, clustering, to extract the populated structures. Visit the clustering recipe for a clustering example using CPPTRAJ.