
Reading the OUT files and plotting different properties.
You want to process the information included in the AMBER output files and extract the data to make plots vs time.
We can use the readdata command in CPPTRAJ to read the output files and store the values in a dataset. Suppose we have five output files with the names:
mdout.1
mdout.2
mdout.3
mdout.4
mdout.5
We can read the files with the CPPTRAJ input:
readdata mdout.1 mdout.2 mdout.3 mdout.4 mdout.5
Alternatively, we can use wildcards for the input:
readdata mdout.*
This will create one dataset, using the name of the first file:
DATASETS (15 total):
	mdout.1[Etot] "mdout.1_Etot" (double), size is 207080
	mdout.1[EPtot] "mdout.1_EPtot" (double), size is 207080
	mdout.1[BOND] "mdout.1_BOND" (double), size is 207080
	mdout.1[ANGLE] "mdout.1_ANGLE" (double), size is 207080
	mdout.1[DIHED] "mdout.1_DIHED" (double), size is 207080
	mdout.1[VDW] "mdout.1_VDW" (double), size is 207080
	mdout.1[EELEC] "mdout.1_EELEC" (double), size is 207080
	mdout.1[VDW1-4] "mdout.1_VDW1-4" (double), size is 207080
	mdout.1[EEL1-4] "mdout.1_EEL1-4" (double), size is 207080
	mdout.1[RST] "mdout.1_RST" (double), size is 207080
	mdout.1[Density] "mdout.1_Density" (double), size is 207080
	mdout.1[EKtot] "mdout.1_EKtot" (double), size is 207080
	mdout.1[VOLUME] "mdout.1_VOLUME" (double), size is 207080
	mdout.1[TEMP] "mdout.1_TEMP" (double), size is 207080
	mdout.1[PRESS] "mdout.1_PRESS" (double), size is 207080
Other option is assign the same name for each readdata command:
readdata mdout.1 name MDOUT
readdata mdout.2 name MDOUT
readdata mdout.3 name MDOUT
readdata mdout.4 name MDOUT
readdata mdout.5 name MDOUT
Which will produce:
DATASETS (15 total):
MDOUT[Etot] "MDOUT_Etot" (double), size is 207080
MDOUT[EPtot] "MDOUT_EPtot" (double), size is 207080
MDOUT[BOND] "MDOUT_BOND" (double), size is 207080
MDOUT[ANGLE] "MDOUT_ANGLE" (double), size is 207080
MDOUT[DIHED] "MDOUT_DIHED" (double), size is 207080
MDOUT[VDW] "MDOUT_VDW" (double), size is 207080
MDOUT[EELEC] "MDOUT_EELEC" (double), size is 207080
MDOUT[VDW1-4] "MDOUT_VDW1-4" (double), size is 207080
MDOUT[EEL1-4] "MDOUT_EEL1-4" (double), size is 207080
MDOUT[RST] "MDOUT_RST" (double), size is 207080
MDOUT[Density] "MDOUT_Density" (double), size is 207080
MDOUT[EKtot] "MDOUT_EKtot" (double), size is 207080
MDOUT[VOLUME] "MDOUT_VOLUME" (double), size is 207080
MDOUT[TEMP] "MDOUT_TEMP" (double), size is 207080
MDOUT[PRESS] "MDOUT_PRESS" (double), size is 207080
With our dataset created, we can use the command writedata to create specific datafiles, for example, to create a plot of Etot vs. time, EPtot vs. time and Temp vs. time:
writedata etot-vs-time.dat MDOUT[Etot] time 0.00002
writedata eptot-vs-time.dat MDOUT[EPtot] time 0.00002
writedata temp-vs-time.dat MDOUT[TEMP] time 0.00002
We use the time option in available in the writedata command to multiplie frame numbers (x-axis) by 0.00002. This will adjust the time and scale it down, see more information on the Data Sets and Data Files and Data File Options. We run the command and will create three files: etot-vs-time.dat, eptot-vs-time.dat and time-vs-time.dat that we can now plot.
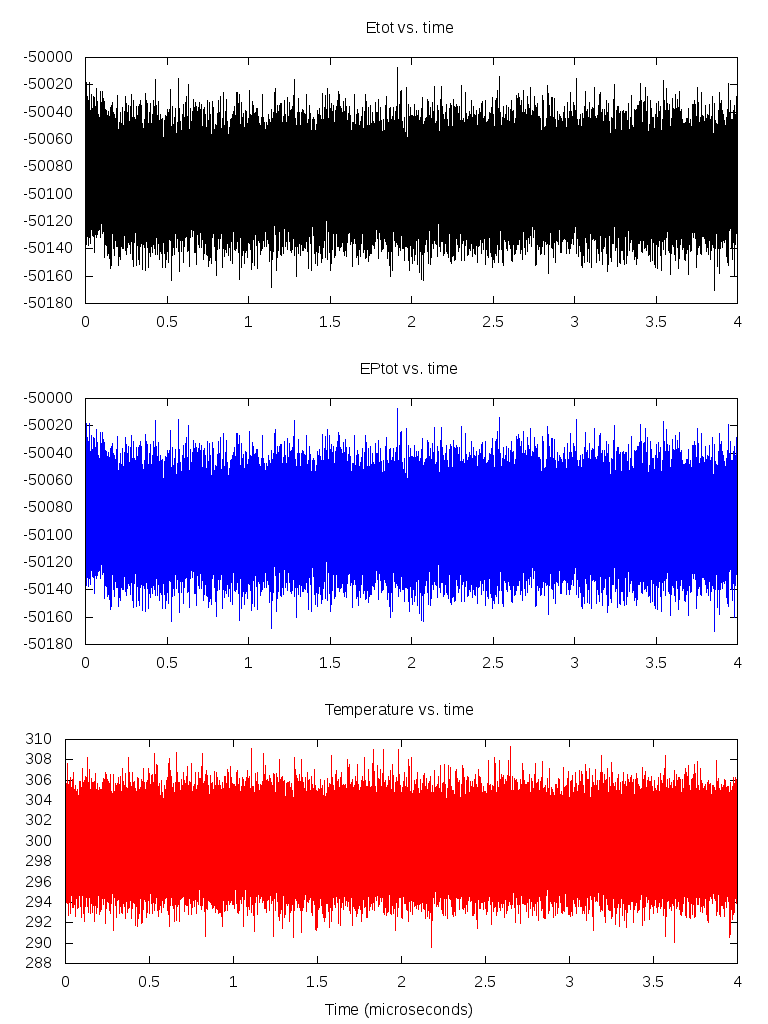
The above picture was generated using the gnuplot script:
set encoding utf8
set term png size 768,1024 font "Arial,12"
set output "mdout.png"
set multiplot layout 3,1
set xrange[0:4]
set title 'Etot vs. time'
plot 'etot-vs-time.dat' w l notitle lt rgb 'black'
set title 'EPtot vs. time'
plot 'eptot-vs-time.dat' w l notitle lt rgb 'blue'
set xlabel "Time (microseconds)"
set title 'Temperature vs. time'
plot 'temp-vs-time.dat' w l notitle lt rgb 'red'