
Generating histograms with CPPTRAJ
Sometimes is useful to present the data as a distribution of values. CPPTRAJ can calculate a histogram for a particular dataset using the hist command. Using an example data of a double stranded 18-mer DNA with sequence d(GGTGACGAGTGAGCTACTGGGCGG) with 100 ns of simulation with NaBr 500mM we can use CPPTRAJ to calculate the RMSD using the first frame as a reference and calculating a histogram for the data. The example trajectory has been autoimaged, rms-fitted to the 18-mer and the water has been stripped to keep the file size low.
Download the 18-mer.parm7 topology and the 18-mer.nc NetCDF data which contains 5000 frames (100 ns). Create (or download) the cpptraj input file:
noexitonerror
parm 18-mer.parm7
trajin 18-mer.nc 1 last 1
rmsd r1 first :1-36 out rms_all.dat time 0.02
 hist r1 norm min 0 max 6 bins 30 out rms_all.hist
rmsd r2 first :3-16,21-34&!@H= out rms_inner.dat time 0.02
 hist r2 norm min 0 max 6 bins 30 out rms_inner.hist
go
Running this script creates four files, two dat files with the results from the RMSD analysis and two hist dat with the RMSD data after the histogram procedure. The noexitonerror is to avoid the script quitting if it encounters an error (for example, a missing trajectory file). Then we read the parmtop file with parm and we load the trajectory file with trajin. Once our trajectory is loaded, we use the rmsd command to create a dataset called ‘r1’. The command will use the first frame as a reference, will read residues 1 to 36 and will generate a file called rms_all.dat. The created ‘r1’ dataset will be used by the hist command to create a histogram of the data with limits 0 to 6 using 30 bins and writing the info to a file called rms_all.hist. The second rmsd command creates the ‘r2’ dataset and is similar to the ‘r1’ but we are only going to consider residues 3 to 16 and 21 to 24 and we are not going to consider any atom with the label ‘H’ (so we are calculating the RMSD of the central base pairs of the DNA without considering hydrogen atoms). The ‘r2’ dataset then is used to generate a second file called rms_inner.hist.
Ploting the results using the program gnuplot, we can generate the following image:
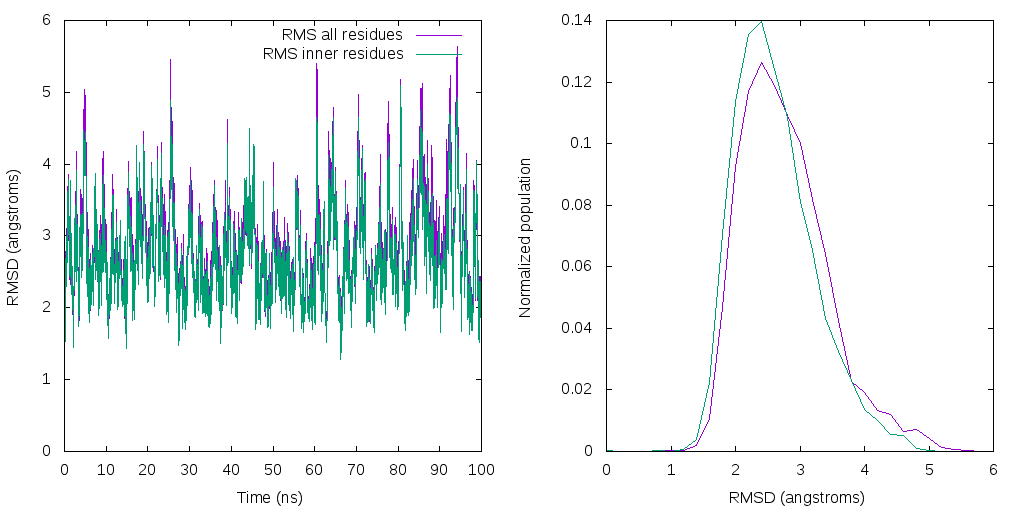
The above picture was generated using the gnuplot script:
set encoding utf8
set term png size 1024,512 font "Arial,12"
set output "hist.png"
set multiplot layout 1,2
set xlabel "Time (ns)"
set ylabel "RMSD (angstroms)"
plot 'rms_all.dat' w l title 'RMS all residues', 'rms_inner.dat' w l title 'RMS inner residues'
set xlabel "RMSD (angstroms)"
set ylabel "Normalized population"
plot 'rms_all.hist' w l notitle, 'rms_inner.hist' w l notitle