Histogram analysis of dihedral angle distributions
You want to obtain the value of multiple dihedral angles from a protein.
It is very common to study the stability of a system through the distributions of specific angles, to see if there is any type of conformational change occurring. One way to do this, is to extract the values of certain dihedral angles over time. We are going to use a 160 ns simulation of the collagen protein from the structure 3b0s. This protein has three interlinked chains with the repeats Gly-Pro-Hyp seven times in each chain. We will extract the dihedral phi and psi angles from the central residues from each chain and plot the normalized distribution of the values.
Download the 3b0s.parm7 topology and the 3b0s.nc NetCDF data which contains 8046 frames (160 ns). The CPPTRAJ input is:
parm 3b0s.parm7
trajin 3b0s.nc 1 last 1
check @C,N,O,CA,CB skipbadframes silent
multidihedral chainone phi psi resrange 10-12  out dihedral-chain-one.dat
multidihedral chaintwo phi psi resrange 31-33 out dihedral-chain-two.dat
multidihedral chainthree phi psi resrange 52-54 out dihedral-chain-three.dat
run
multihist chainone[*] out dihedral-chain-one.hist normint min -180 max 180 step 1
multihist chaintwo[*] out dihedral-chain-two.hist normint min -180 max 180 step 1
multihist chaintwo[*] out dihedral-chain-three.hist normint min -180 max 180 step 1
run
The script first reads the topology file (parm) and the trajectory file (trajin). The use of the check command verifies each frame for problems related to atomic overlap or uncommon bond lengths. this will be based on the mask @C,N,O,CA,CB which corresponds to the backbone of the molecule. Frames with problems will be skipped. Using the multidihedral command allows us to perform multiple analysis over a range of atoms, instead of calling the dihedral command for each torsion we want to analyze. We will analyze the central Gly-Pro-Hyp for each chain, so we call the multidihedral command three times. Notice that multidihedral does not use a mask to select atoms, but uses a range. For each time we call the command, we name it with a different datset name (chainone, chaintwo, chainthree). This allows us to store the data so we can use it later to do a histogram of the values. We need the datasets to actually contain data, so we run the script. It will read the topology file, then read the 8046 frames and populate the datasets, which we can use with the multihist command. The multihist will read the dataset chainone, chaintwo or chainthree, reading all the values from each one ([*]) and will calculate the normalized (normint) histogram using a min and max value of -180 and 180 respectively.
The result can be plotted like this:
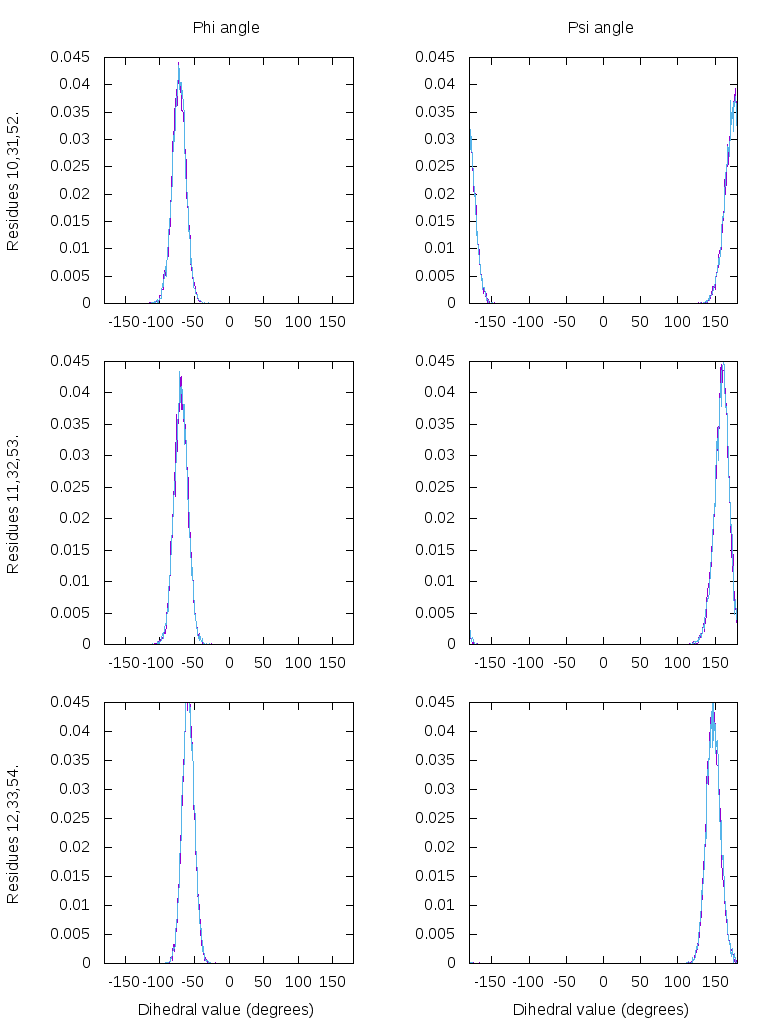
The above picture was generated using the gnuplot script:
set encoding utf8
set term png size 768,1024 font "Arial,12"
set output "dihedrals.png"
set multiplot layout 3,2
set xrange[-180:180]
set yrange[0:0.045]
set title 'Phi angle'
set ylabel "Residues 10,31,52."
plot 'dihedral-chain-one.hist' u 1:2 w l notitle, 'dihedral-chain-two.hist' u 1:2 w l notitle, 'dihedral-chain-three.hist' u 1:2 w l notitle
set title 'Psi angle'
unset ylabel
plot 'dihedral-chain-one.hist' u 1:3 w l notitle, 'dihedral-chain-two.hist' u 1:3 w l notitle, 'dihedral-chain-three.hist' u 1:3 w l notitle
unset title
set ylabel "Residues 11,32,53."
plot 'dihedral-chain-one.hist' u 1:4 w l notitle, 'dihedral-chain-two.hist' u 1:4 w l notitle, 'dihedral-chain-three.hist' u 1:4 w l notitle
unset ylabel
plot 'dihedral-chain-one.hist' u 1:5 w l notitle, 'dihedral-chain-two.hist' u 1:5 w l notitle, 'dihedral-chain-three.hist' u 1:5 w l notitle
set xlabel "Dihedral value (degrees)"
set ylabel "Residues 12,33,54."
plot 'dihedral-chain-one.hist' u 1:6 w l notitle, 'dihedral-chain-two.hist' u 1:6 w l notitle, 'dihedral-chain-three.hist' u 1:6 w l notitle
set xlabel "Dihedral value (degrees)"
unset ylabel
plot 'dihedral-chain-one.hist' u 1:7 w l notitle, 'dihedral-chain-two.hist' u 1:7 w l notitle, 'dihedral-chain-three.hist' u 1:7 w l notitle