
Detect amino acid interactions
You want to study the specific interactions between a protein and a small peptide.
In this recipe we are going to use the system published by Mudd and collaborators which consists of an enzyme (receptor tyrosine kinase) and a constrained bicyclic peptide that binds to the kinase. The PDB entry is 6RW2 and a 100 ns simulations is presented in the video:
The system consists of the receptor (residues 1 to 175) and a bicycle peptide (residues 176 to 194) bound to the receptor. The topology file and the trajectory file are available to download. We will use the nativecontacts command from CPPTRAJ to detect the relevant amino acid interactions between the receptor and the peptide. The native contacts will use the first frame to detect contacts between the receptor and the ligand and set those contacts as ‘native’. Contacts are defined by a distance cut-off that has a default value of 7 Angstroms. In our script we will use a cut-off distance of 3 Angstroms using the distance keyword. The CPPTRAJ input is:
parm nowater.topo
trajin nowater.nc

nativecontacts name NC1 :1-175&!@H= :176-194&!@H= \
   writecontacts native-contacts.dat \
   resout resout.dat \
   distance 3.0 \
   byresidue out all-residues.dat mindist maxdist \
   map mapout gnu \
   contactpdb contactspdb.pdb \
   series seriesout native-contacts-series.dat
run
lifetime NC1[NC] out lifetime.dat
run
Running the script will output, among other useful information, the detected native contacts from the first frame:
 Using first frame to determine native contacts.
Mask [:1-175&!@H*] corresponds to 1409 atoms.
Mask [:176-194&!@H*] corresponds to 155 atoms.
Setup 4 native contacts:
Atom ':27@OD2' to ':177@NH1'
Atom ':30@N' to ':192@O'
Atom ':31@ND2' to ':189@O'
Atom ':77@NH1' to ':181@O'
This information will be used by CPPTRAJ to flag those interactions as ‘native’ (which translates to the initial contacts detected between the receptor and the peptide, considering a distance cut-off of 3.0 Angstroms); this information will be saved in the native-contacts.dat file. The nativecontacts dataset has the name of NC1 that can be referenced in other analysis if needed. This native-contacts.dat file looks like:
# Contacts: NC1
# Native contacts determined from mask ':1-175&!@H*' and mask ':176-194&!@H*'
# Contact          Nframes   Frac.    Avg  Stdev
1 :77@NH1_:181@O   3648      0.795    2.82 0.0922
2 :31@ND2_:189@O   249       0.0543   2.86 0.0871
3 :30@N_:192@O     28        0.0061   2.9  0.0621
4 :27@OD2_:177@NH1 7         0.00153  2.82 0.0831
We can see 4 initial contacts that satisfy the distance cut-off; the contact between residue 77 and residue 181 has the highest value of duration or lifetime with 3648 frames out of a total frames of 4588 which corresponds to 79.5%. This information is presented in a similar way in the resout.dat file. The byresidue keyword allow us to do the analysis by residue instead using each atom. The output file for this keyword (all-residues.dat) is in the GNUPLOT format. If we use the command gnuplot all-residues.dat, we can see the plot:
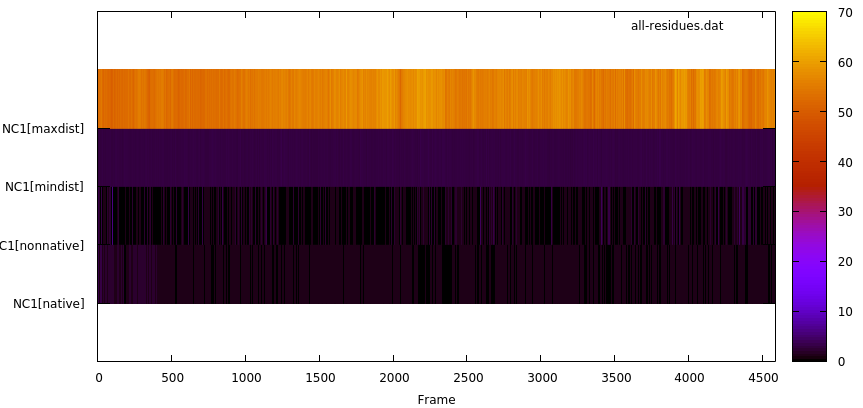
With this plot we can learn the overall behaviour of the native contacts in our system. The plot shows the maximum and minimum distance (in Angstroms) throughout the simulations (4588 frames in this example), and we can see the difference between native (those detected using the first frame as reference) and non-native contacts (new contacts that where not detected in the first frame).
Next we have the map command that will calculate the contacts (both native and non-native) in a matrix style of analysis. This means that all the residues from the receptor will be compared with all the residues of the peptide binding to the receptor. The plots with the name native.gnu and nonnative.gnu look like:
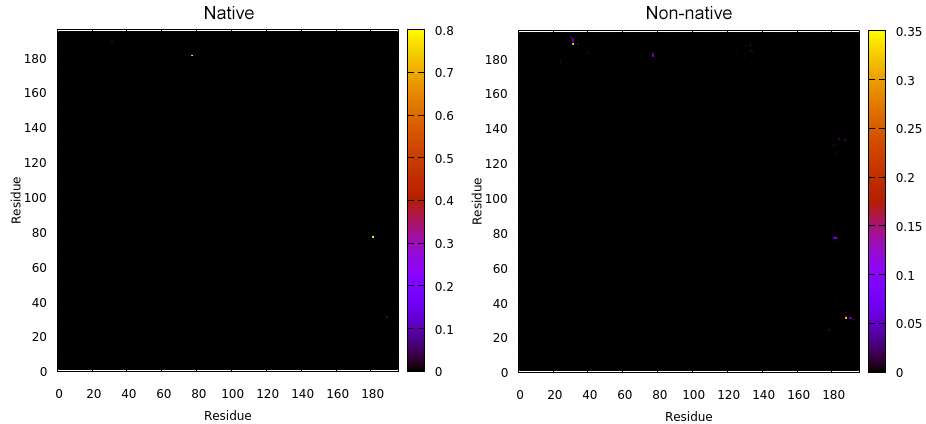
This GNUPLOT files are generated by CPPTRAJ when using the map keyword. The left plot (native.gnu) shows that we have an interaction between residues 77 and 181, the same information from the files resout.dat and all-residues. dat. The non-native plot in the right shows interactions that where not detected in the first frame, which was our native contacts reference. This suggests that in the simulation, new contacts between the receptor and the ligand formed that could be useful for further analysis. The next information available from the contactpdb keyword is a PDB file that uses the ‘b-factor’ column (10th position) that shows the relative contact strenght for native contacts, which the top value is 100. Using UCSF-Chimera, in the Tools -> Depiction -> Render by attribute, we can generate a model that shows the values of the b-factor column, as presented here:
We can see that the blue colored regions are in a contact distance of 3.7 Angstroms whereas the red regions do not have any contact with the receptor.
The last part of the analysis involves using the ‘series’ command to calculate native contact time series. The file has 1 when a contact is present and a 0 when it does not. We can feed that file to the lifetime command to generate a lifetime plot:
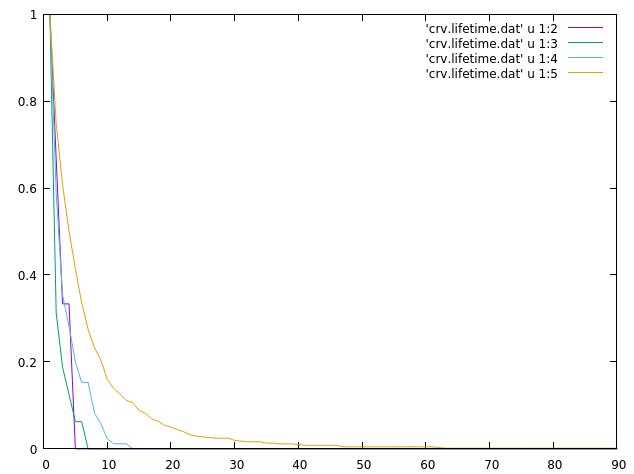
This plot was generated quickly with the command:
gnuplot> plot 'crv.lifetime.dat' u 1:2 w l, \
          'crv.lifetime.dat' u 1:3 w l, \
          'crv.lifetime.dat' u 1:4 w l, \
          'crv.lifetime.dat' u 1:5 w l
The plot indicates that the dataset in the 5th column has a higher lifetime than the data in columns 2 to 4th, remember that the crv.lifetime.dat file has the time on the first column. The lifetime.dat file is presented here:
#Set lifetime_00011 lifetime_00011[max] lifetime_00011[avg] lifetime_00011[frames] lifetime_00011[name]
1    3              4                   2.3333              7                      :27@OD2_:177@NH1
2    16             6                   1.7500              28                     :30@N_:192@O
3    85             13                  2.9294              249                    :31@ND2_:189@O
4    611            90                  5.9705              3648                   :77@NH1_:181@O
This file shows in a quantitative way what is observed in the plot. The #4 Set lifetime has 611 frames with a maximum continuous life of 90 frames. This contact is between residues 77 of the receptor and 181 of the peptide which is the most present contact in this particular simulation.
With these analysis we have shown a way to study the specific contacts between two systems and obtain lifetime information between specific residues that will allow for further analysis.